Agile Management - Complexity Thinking View more presentations from Jurgen Appelo.
Story of a (Fictional) Doomed Software Business
This is the story of a doomed software business. Any resemblance to existing businesses is purely coincidental.
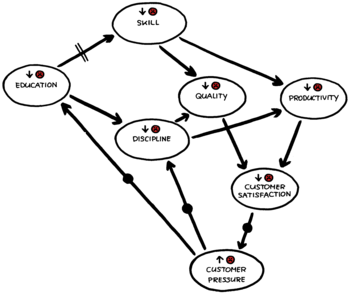
Once, in a land far far away, there was a software business with unhappy customers. (This is, fortunately, a fictional story.) Customer satisfaction in this business was low because both the productivity of teams and the quality of their products were low. Productivity and quality were low because, to be honest, the skills of the people involved were not very high. And their discipline in daily practices also left much to be desired. (See Figure 1)
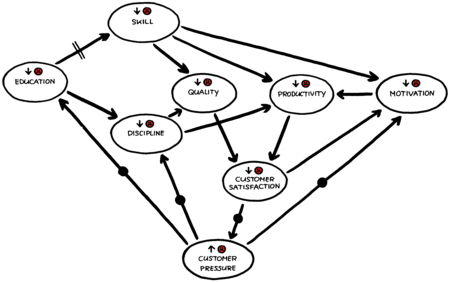
The result of the dissatisfaction among customers was that it increased pressure on the software teams. Having to attend to their customers’ needs every minute of the day led to a decrease in the time available for education, which, over a period of time, further reduced the team members’ skills. And, combined with an increased stress level among employees, it also had an impact on their discipline. (See Figure 2)
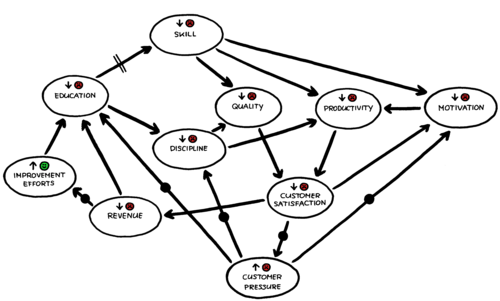
Working with unhappy customers also made the employees themselves unhappy. And their motivation dropped even further because of the increased pressure, and their feelings of not having the means and skills to deal with the situation. Finally, low motivation among employees led to a further decrease in the productivity of teams. (See Figure 3)
The diagram in Figure 3 is called a Diagram of Effects (DOE), or a Causal Loop Diagram (CLD). It illustrates that this (fictional) software company suffered from various vicious cycles. Low quality and productivity led to low customer satisfaction and high pressure, which led to reduced education, discipline and skill, which then reinforced the low quality and productivity. Also, low productivity led to unhappy customers and increased pressure, which led to demotivated teams, which then reinforced the low productivity.
Causal Loop Diagrams
The bubbles in a CLD represent variables that can go up or down. The arrows indicate the effects these variables have on each other. When an increase of a variable causes another one to decrease, and vice versa, we draw a black dot in the middle of the arrow. Another possibility is a delayed effect, which we indicate with two dashes in an arrow. (See: Weinberg, Gerald. An Introduction to General Systems Thinking: Silver Anniversary Edition. New York: Dorset House, 2001)
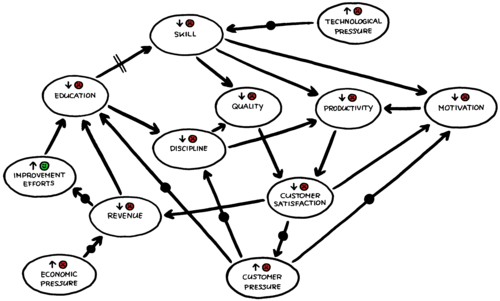
The CLD in Figure 4 shows the influence that management had on this (fictitious) situation. The problem of reduced customer satisfaction confronted management with reduced revenues. But, while managers increased support for various improvement efforts in teams, like the adoption of Scrum and Extreme Programming, they also felt the deteriorating financial situation called for cutting budgets, including the budget for education.
Meanwhile, the environment of this software business wasn’t making things any easier. The economy was in a turmoil, which increased pressure on the company’s revenues. And at the same time technological progress kept accelerating, which further eroded the skillsets of the people in the business, who found themselves unable to keep up with technological innovations. (See Figure 5)
And so it seemed that this (fantastical) software business was doomed. No matter how it tried to free itself, the monster of evil vicious cycles kept this business firmly locked in a castle of misery.
But then, some managers decided to take a course on Agile Management. They learned to tame the beasts of Nonlinearity and Unpredictability, and freed the software business of its misery. And the people worked happily ever after…


